
This week we released information sets to schools, further education providers and inspectors that help frame our inspection activity. These are called the Inspection Data Summary Report (IDSR) for schools and Further Education and Skills Inspection Tool (FESIT) for further education (FE) providers.
Ahead of inspections under the renewed inspection framework that we published in September, the IDSR and FESIT have also been redeveloped. In this blog, we explain what’s changed and describe how we use data on inspection. For more information and more detail on the IDSR please sign up for our webinar on 3 December.
It has always been the case that data is only the starting point for inspection. We do not make grading decisions on the basis of data alone – but the data can help suggest areas of focus to be discussed between inspectors and leaders.
Data also helps establish the context for inspection. Under the changes we have made to inspection, we want a school, nursery, childminder or college’s context to be taken into account when we evaluate how the provider is meeting the needs of children and learners. Understanding the published data, where it’s available, helps us do that.
The new-style IDSR and FESIT
The new-style IDSR and FESIT presents data differently from previous versions. The statistical interpretation has also changed, with a stronger focus on where a school or provider sits within the national distribution. Inspectors will be able to explore patterns in pupil and learner outcomes over time, compared to national averages.
For example, for each achievement measure, a provider will be placed into one of three bandings depending on where it sits on a national distribution range. Performance near the average range in the centre of the distribution will be banded as ‘close to average’. Any school or FE provider that reaches above this range will be banded as ‘above average’ and those that fall below will be banded as ‘below average’.
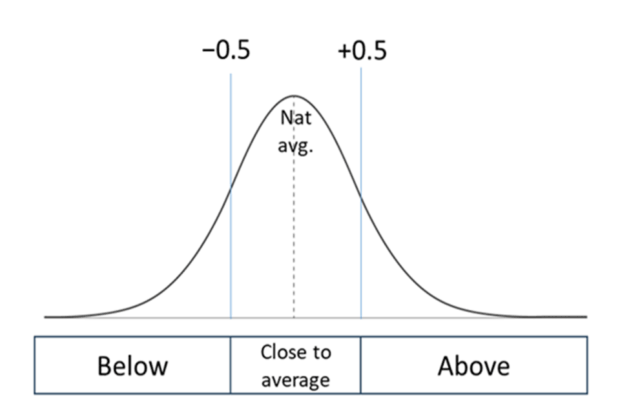
Our inspectors will never look at a single measure for a single year in isolation. Reviewing data over multiple years and across multiple measures helps identify consistent and comprehensive patterns and emerging trends – and smooths out year-to-year variation, which might be particularly evident in, for example, small primary schools.
Example IDSR distribution chart
While a school’s place in the national distribution will be the main descriptor of its performance, inspectors will also rely on analysis of statistical significance.
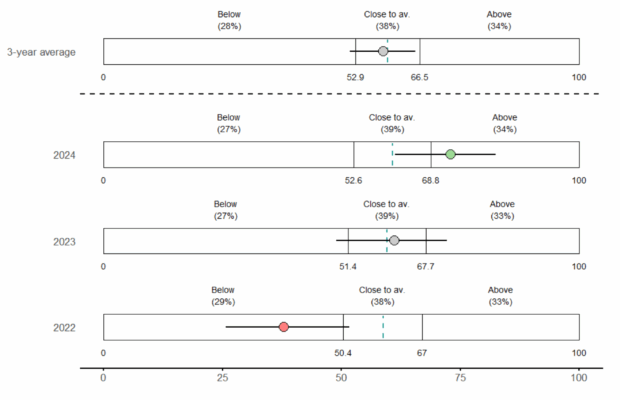
As shown in the above primary school example, the coloured dot demonstrates where a school sits on a given measure. The horizontal lines coming out from the dot indicate the confidence we can have that the dot is truly representative of the cohort of pupils. Small cohorts typically have much greater variability and wider horizontal lines. These upper and lower limits show whether the outcome is significantly different from the national average or not.
Where both ends of the horizontal lines are clear of the vertical dotted national average line, we can be extremely confident that this data point is statistically different from the average. Where the horizontal line crosses over the vertical national average line, we cannot be confident that it is different from the national average. So, the lines don’t indicate how far outcomes are from the national average, they indicate how certain we can be that the observed difference is not due to chance.
Considering context in the schools IDSR
The IDSR will flag context about pupil cohorts, including cohort stability and levels of disadvantage, as well as the proportion of pupils with SEND within schools. These context flags are provided for the whole school, as well as the year groups that sat relevant tests or assessments.
In the example below, we see a school that is improving over time, moving from the ‘below’ banding in 2022 to the ‘above’ banding in 2024. The table displays the bandings in colour-coded cells. The ‘trend’ column shows if the change from one year to the next is significant and the ‘context’ column shows whether the year group faced significant barriers to learning compared to the national year group average (in this case the year group had very high proportions of pupils eligible for free school meals).

Inspectors will consider these context flags when evaluating the achievement picture of a school.
Using data: our new achievement evaluation area
When we talk about achievement, we are talking about attainment and progress. Achievement includes pupils’ and learners’ foundational knowledge and skills – early reading, writing and mathematics – which help them access the wider curriculum. Achievement also encompasses the detailed knowledge and skills that pupils, learners and apprentices develop across subjects, the qualifications they achieve, and their readiness for their next steps.
We know that performance data focused on specific year groups, subjects and qualifications is important, but incomplete. It cannot account for the full impact of the school’s work on outcomes for pupils and learners.
When evaluating pupils’ or learners’ achievement, inspectors draw on two sources of evidence: the information they gather on site, and what the data tells them. Together, these elements form a holistic view of achievement that inspectors consider when reaching a grading decision.
For example, the IDSR and FESIT may indicate that a FE provider or a school's performance for a given measure has improved over time. But the reasons for the improvement, and the leadership decisions that have driven it, will need to be explored while on site. Alternatively, the data may show that outcomes have declined over the latest year. This may be due to a recent shift in the cohort, increased levels of mobility among its population, or a range of other factors that cannot be discerned by looking at the IDSR and FESIT alone. And of course, data tells us more in some settings than in others. In some special schools and alternative provision, there is little or no published data about pupils’ outcomes, so our on-site work becomes even more important.
How data and on-site inspection give the full picture
Used thoughtfully, data informs inspection in a way that is rigorous, consistent and fair. But on-site inspection activity will always play a significant and crucial role in helping inspectors understand how pupils or learners are progressing from their starting points.
The balance between these two sources of evidence – the published data and the on-site inspection activity – is not fixed. It shifts depending on the context, and how comprehensive and compelling the data is. Inspectors use the published data to shape their conversation with leaders in their pre-inspection call, and to consider which inspection activities will be most useful to answer the questions they have.
Want to know more?
You can watch our webinar on using data on school inspection.